vSRX IPsec core dump using GNS3
Some context
Recently I've been studying for my JNCIA-SEC certificate, using the Juniper Open Learning portal & lessons. However I always set up the labs myself on my own kit.
I got to the IPsec site to site VPN part of the course and I was happy enough to go onto my lab and put a couple vSRX instances each with a simulated internet connection and LAN, then create a tunnel between each other and make sure it works or troubleshoot it until it does.
Unfortunately as soon as I created the site to site IPsec VPN I saw my vSRX instances lose connectivity.
Figuring out what happened
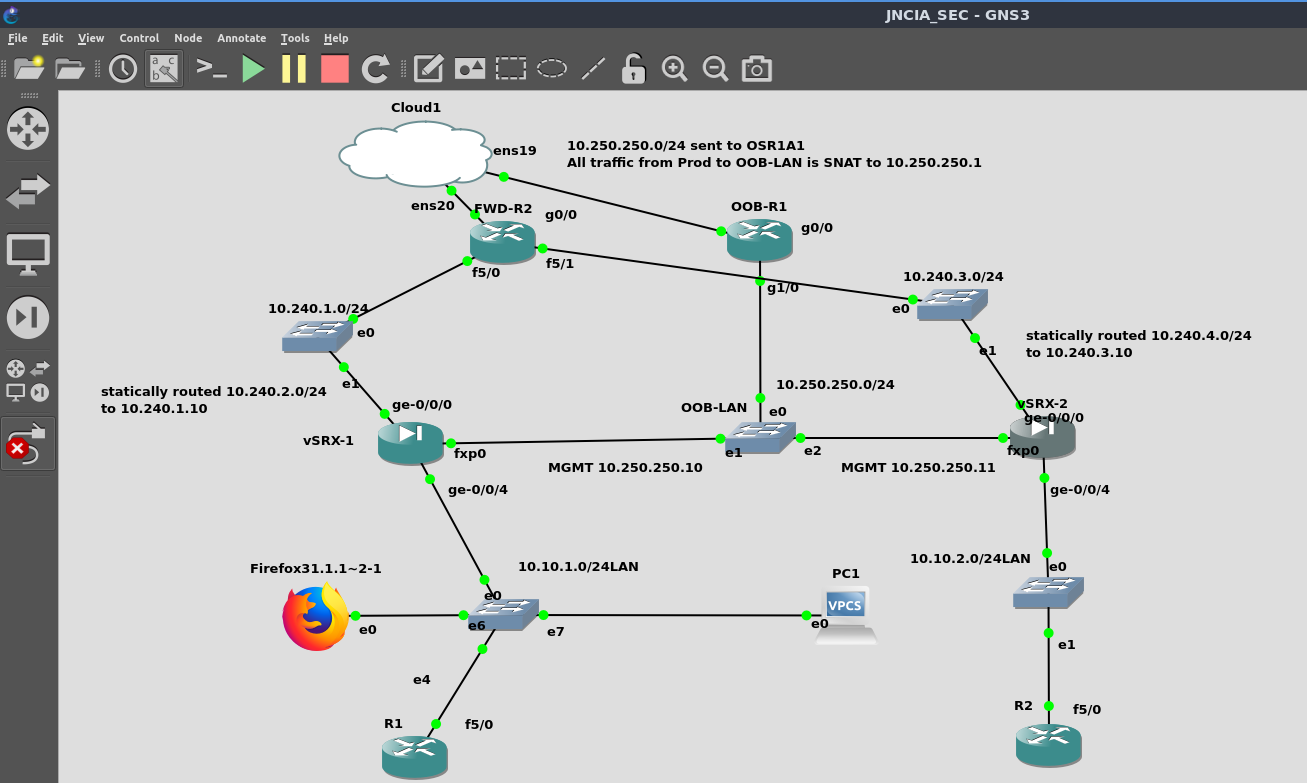
The current GNS3 project I have for the vSRX site to site VPN lab is below:
 Current setup
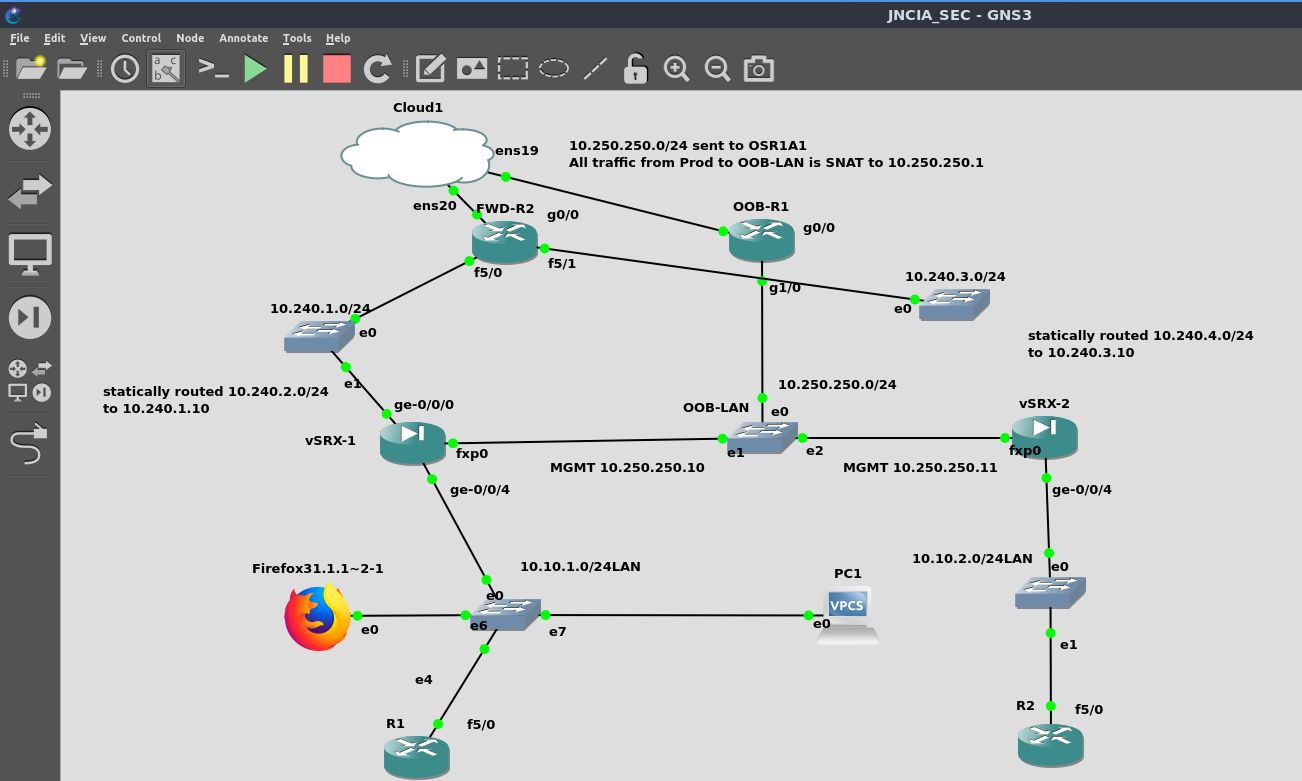
In order to reliably replicate the fault I decided to disconnect vSRX-2 ge-0/0/0 connection to the switch where network 10.240.3.0/24 exists. This network as well as 10.240.1.0/24 are supposed to be the WAN subnets for the vSRX VMs, and FWD-R2 connects both of these "simulated internet" subnets to my actual Prod network.
 Lab with one virtual cable disconnected
Here's some output from vSRX-2 as I connected the missing "cable": The tunnel comes up (st0.0) then we get a bunch of logspam on the CLI (and then all the forwarding interfaces will disappear, not shown below)
 1fabrizzio@vSRX-2> show interfaces terse
 2Interface               Admin Link Proto    Local                 Remote
 3ge-0/0/0                up    up
 4ge-0/0/0.0              up    up   inet     10.240.3.10/24
 5gr-0/0/0                up    up
 6ip-0/0/0                up    up
 7lsq-0/0/0               up    up
 8lt-0/0/0                up    up
 9mt-0/0/0                up    up
10sp-0/0/0                up    up
11sp-0/0/0.0              up    up   inet
12                                   inet6
13sp-0/0/0.16383          up    up   inet
14ge-0/0/1                up    down
15ge-0/0/2                up    down
16ge-0/0/3                up    down
17ge-0/0/4                up    up
18ge-0/0/4.0              up    up   inet     10.10.2.1/24
19dsc                     up    up
20fti0                    up    up
21fxp0                    up    up
22fxp0.0                  up    up   inet     10.250.250.11/24
23gre                     up    up
24ipip                    up    up
25irb                     up    up
26lo0                     up    up
27lo0.16384               up    up   inet     127.0.0.1           --> 0/0
28lo0.16385               up    up   inet     10.0.0.1            --> 0/0
29                                            10.0.0.16           --> 0/0
30                                            128.0.0.1           --> 0/0
31                                            128.0.0.4           --> 0/0
32                                            128.0.1.16          --> 0/0
33lo0.32768               up    up
34lsi                     up    up
35mtun                    up    up
36pimd                    up    up
37pime                    up    up
38pp0                     up    up
39ppd0                    up    up
40ppe0                    up    up
41st0                     up    up
42st0.0                   up    up   inet
43tap                     up    up
44vlan                    up    down
45
46fabrizzio@vSRX-2> nic_uio0: Bar 1 @ feb92000, size 1000
47nic_uio0: Bar 4 @ fe004000, size 4000
48nic_uio0: Bar 1 @ feb92000, size 1000
49nic_uio0: Bar 4 @ fe004000, size 4000
50nic_uio1: Bar 1 @ feb93000, size 1000
51nic_uio1: Bar 4 @ fe008000, size 4000
52nic_uio1: Bar 1 @ feb93000, size 1000
53nic_uio1: Bar 4 @ fe008000, size 4000
54nic_uio2: Bar 1 @ feb94000, size 1000
55nic_uio2: Bar 4 @ fe00c000, size 4000
56nic_uio2: Bar 1 @ feb94000, size 1000
57nic_uio2: Bar 4 @ fe00c000, size 4000
58nic_uio3: Bar 1 @ feb95000, size 1000
59nic_uio3: Bar 4 @ fe010000, size 4000
60nic_uio3: Bar 1 @ feb95000, size 1000
61nic_uio3: Bar 4 @ fe010000, size 4000
62nic_uio4: Bar 1 @ feb96000, size 1000
63nic_uio4: Bar 4 @ fe014000, size 4000
64nic_uio4: Bar 1 @ feb96000, size 1000
65nic_uio4: Bar 4 @ fe014000, size 4000
The logfile shows the issue very clearly:
 1Oct 19 16:53:24  vSRX-2 mib2d[19111]: SNMP_TRAP_LINK_UP: ifIndex 521, ifAdminStatus up(1), ifOperStatus up(1), ifName ge-0/0/0.0
 2Oct 19 16:53:24  vSRX-2 dpdk_eth_devstart (pid=0x59d96e80): port 0 ifd ge-0/0/0, new dpdk_port_state=2 dpdk_swt_port_state 1
 3Oct 19 16:53:24  vSRX-2 dpdk_eth_devstart (pid=0x59d96e80): port 0 has already been started, dpdk_port_state=2 dpdk_swt_port_state 1
 4Oct 19 16:53:24  vSRX-2 rpd[19113]: RPD_IFL_NOTIFICATION: EVENT [UpDown] ge-0/0/0.0 index 72 [Up Broadcast Multicast] address #0 c.59.c6.c4.0.1
 5Oct 19 16:53:24  vSRX-2 rpd[19113]: RPD_IFA_NOTIFICATION: EVENT <UpDown> ge-0/0/0.0 index 72 10.240.3.10/24 -> 10.240.3.255 <Up Broadcast Multicast>
 6Oct 19 16:53:24  vSRX-2 rpd[19113]: RPD_RT_HWM_NOTICE: New RIB highwatermark for unique destinations: 13 [2023-10-19 16:53:24]
 7Oct 19 16:53:24  vSRX-2 rpd[19113]: RPD_RT_HWM_NOTICE: New RIB highwatermark for routes: 13 [2023-10-19 16:53:24]
 8Oct 19 16:53:24  vSRX-2 rpd[19113]: RPD_IFD_NOTIFICATION: EVENT <UpDown> ge-0/0/0 index 136 <Up Broadcast Multicast> address #0 c.59.c6.c4.0.1
 9Oct 19 16:53:26  vSRX-2 srxpfe[19152]: pconn_client_create: RE address for IRI1 1000080 cid is 0
10Oct 19 16:53:26  vSRX-2 kmd[19126]: KMD_PM_SA_ESTABLISHED: Local gateway: 10.240.3.10, Remote gateway: 10.240.1.10, Local ID: ipv4_subnet(any:0,[0..7]=0.0.0.0/0), Remote ID: ipv4_subnet(any:0,[0..7]=0.0.0.0/0), Direction: inbound, SPI: 0xbd4f7f41, AUX-SPI: 0, Mode: Tunnel, Type: dynamic, Traffic-selector:  FC Name:
11Oct 19 16:53:26  vSRX-2 kmd[19126]: KMD_PM_SA_ESTABLISHED: Local gateway: 10.240.3.10, Remote gateway: 10.240.1.10, Local ID: ipv4_subnet(any:0,[0..7]=0.0.0.0/0), Remote ID: ipv4_subnet(any:0,[0..7]=0.0.0.0/0), Direction: outbound, SPI: 0xed0bd9a2, AUX-SPI: 0, Mode: Tunnel, Type: dynamic, Traffic-selector:  FC Name:
12Oct 19 16:53:26  vSRX-2 kmd[19126]: KMD_VPN_UP_ALARM_USER: VPN SRX2-to-SRX1 from 10.240.1.10 is up. Local-ip: 10.240.3.10, gateway name: SRX2-to-SRX1, vpn name: SRX2-to-SRX1, tunnel-id: 131073, local tunnel-if: st0.0, remote tunnel-ip: Not-Available, Local IKE-ID:  ▒^C , Remote IKE-ID: 10.240.1.10, AAA username: Not-Applicable, VR id: 0, Traffic-selector: , Traffic-selector local ID: ipv4_subnet(any:0,[0..7]=0.0.0.0/0), Traffic-selector remote ID: ipv4_subnet(any:0,[0..7]=0.0.0.0/0), SA Type: Static
13Oct 19 16:53:26  vSRX-2 kmd[19126]: IKE negotiation successfully completed. IKE Version: 2, VPN: SRX2-to-SRX1 Gateway: SRX2-to-SRX1, Local: 10.240.3.10/500, Remote: 10.240.1.10/500, Local IKE-ID: 10.240.3.10, Remote IKE-ID: 10.240.1.10, VR-ID: 0, Role: Responder
14Oct 19 16:53:26  vSRX-2 rpd[19113]: RPD_IFL_NOTIFICATION: EVENT [UpDown] st0.0 index 70 [Up PointToPoint Multicast]
15Oct 19 16:53:26  vSRX-2 rpd[19113]: RPD_IFA_NOTIFICATION: EVENT <UpDown> st0.0 index 70 <Up PointToPoint Multicast>
16Oct 19 16:53:26  vSRX-2 mib2d[19111]: SNMP_TRAP_LINK_UP: ifIndex 523, ifAdminStatus up(1), ifOperStatus up(1), ifName st0.0
17Oct 19 16:53:51  vSRX-2 mgd[19457]: UI_CMDLINE_READ_LINE: User 'fabrizzio', command 'show interfaces terse '
18Oct 19 16:53:51  vSRX-2 mgd[19457]: UI_CHILD_START: Starting child '/sbin/ifinfo'
19Oct 19 16:53:52  vSRX-2 mgd[19457]: UI_CHILD_STATUS: Cleanup child '/sbin/ifinfo', PID 19487, status 0
20Oct 19 16:53:54  vSRX-2 rpd[19113]: RPD_RT_HWM_NOTICE: New RIB highwatermark for unique destinations: 15 [2023-10-19 16:53:26]
21Oct 19 16:53:54  vSRX-2 rpd[19113]: RPD_RT_HWM_NOTICE: New RIB highwatermark for routes: 15 [2023-10-19 16:53:26]
22Oct 19 16:54:01  vSRX-2 mgd[19457]: UI_CMDLINE_READ_LINE: User 'fabrizzio', command 'show interfaces terse '
23Oct 19 16:54:01  vSRX-2 mgd[19457]: UI_CHILD_START: Starting child '/sbin/ifinfo'
24Oct 19 16:54:01  vSRX-2 mgd[19457]: UI_CHILD_STATUS: Cleanup child '/sbin/ifinfo', PID 19494, status 0
25Oct 19 16:54:03  vSRX-2 aamwd[19218]: IPID-IPC-ERROR: usp_ipc_server_dispatch: failed to read messages from socket
26Oct 19 16:54:03  vSRX-2 kernel: pid 19152 (srxpfe), jid 0, uid 0: exited on signal 10 (core dumped)
27Oct 19 16:54:03  vSRX-2 chassisd[19105]: CHASSISD_FRU_OFFLINE_NOTICE: Taking FPC 0 offline: Error
28Oct 19 16:54:03  vSRX-2 kernel: peer_input_pending_internal: 6152: peer class: 0, type: 10, index: 0, vksid: 0, state: 1 reported a sb_state 32 = SBS_CANTRCVMORE
29Oct 19 16:54:03  vSRX-2 kernel: peer_input_pending_internal: 6152: peer class: 0, type: 10, index: 0, vksid: 0, state: 1 reported a sb_state 32 = SBS_CANTRCVMORE
30Oct 19 16:54:03  vSRX-2 kernel: peer_inputs: 6410: VKS0 closing connection peer class: 0, type: 10, index: 0, vksid: 0, state: 1, err 5
31Oct 19 16:54:03  vSRX-2 kernel: peer_socket_close: peer 0x80000001 (type 10 index 0), so_error 0, snd sb_state 0x0, rcv sb_state 0x20
32Oct 19 16:54:03  vSRX-2 kernel: pfe_peer_update_mgmt_state: 273: class: 0, type: 10, index: 0, vksid: 0, old state Online new state Valid mastership 1
33Oct 19 16:54:03  vSRX-2 kernel: pfe_peer_set_timeout: setting reconnect timeout of 15 sec for peer type=10, index=0
34Oct 19 16:54:03  vSRX-2 chassisd[19105]: CHASSISD_IFDEV_DETACH_FPC: ifdev_detach_fpc(0)
As seen above, as soon as the tunnel establishes, srxpfe crashes and does a core dump. It will restart and crash again. This happens over and over.
Fixing the issue
I was running vSRX 22.1R1.10 inside my lab, I went to the Juniper website and downloaded vSRX 23.2R1-S1.6 and created some GNS3 templates with that image. This did not solve the issue.
I also tried re-creating the vSRX instance hosted within one of my beefier computers, I thought something might have been timing out. This also didn't solve the fault.
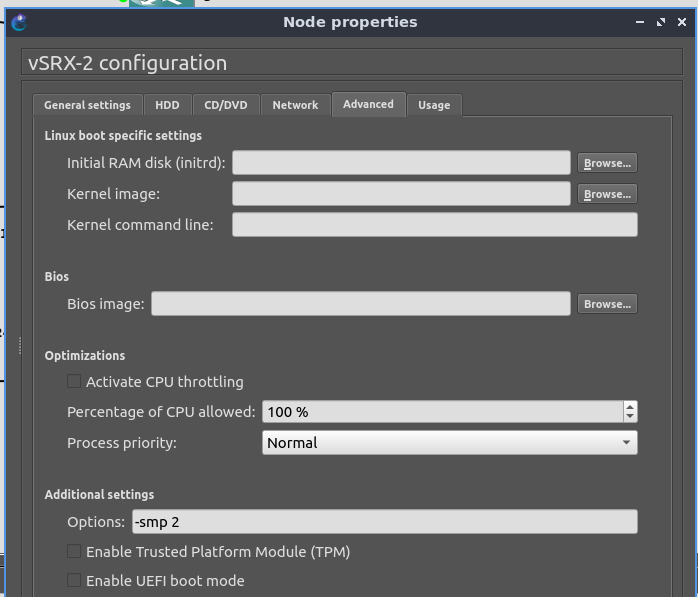
I had a wild guess that it might be caused by AES-NI or some other instruction not being present when GNS3 runs the vSRX VM using QEMU:
 Default config for a vSRX VM in GNS3
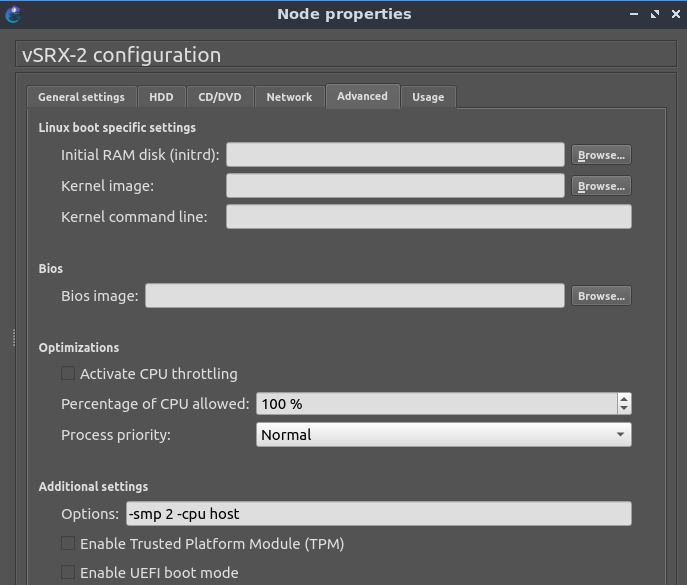
I just went and added "-cpu host" to the additional settings. All my VMs on my Proxmox servers (including my GNS3 server VMs) already have the CPU configured as "host", otherwise I'd have to do it too. This did fix the problem.
 Good config for a vSRX VM in GNS3
Conclusions
It is very odd that this is not documented anywhere. Not even ChatGPT could tell me why was I getting the srxpfe crashes. I hope this post might be useful for someone working on their Juniper certs too :)
Extra details
I just wanted to mention why I had also a router called OOB-LAN in my GNS3 LAB.
That router is just doing SNAT from my Prod network towards the OOB network on my LAB (and distributing that network via BGP into my Prod network). That way, when connecting to the vSRX management interfaces from my Prod network, the vSRX nodes will see the connections coming from the IP address of the OOB-LAN router interface Gi1/0 (10.250.250.1). Because I've assigned addresses within that network to all my LAB fxp0 interfaces I don't even have to bother with a static route on the vSRX.