Current status
UptimeRobot <--- Current network status via UptimeRobot
Network Graphs.
For your information. Latency is being measured from my LibreNMS that should be routing via PRG1CR5. So all measurements are from PRG1.
These graphs should auto-update every 10 minutes. Please refresh using CTRL+F5. I haven't figured out how to stop the browser from caching even though I've messed with the Cache-Control headers.
 Last update time
PRG2 LTE Signal
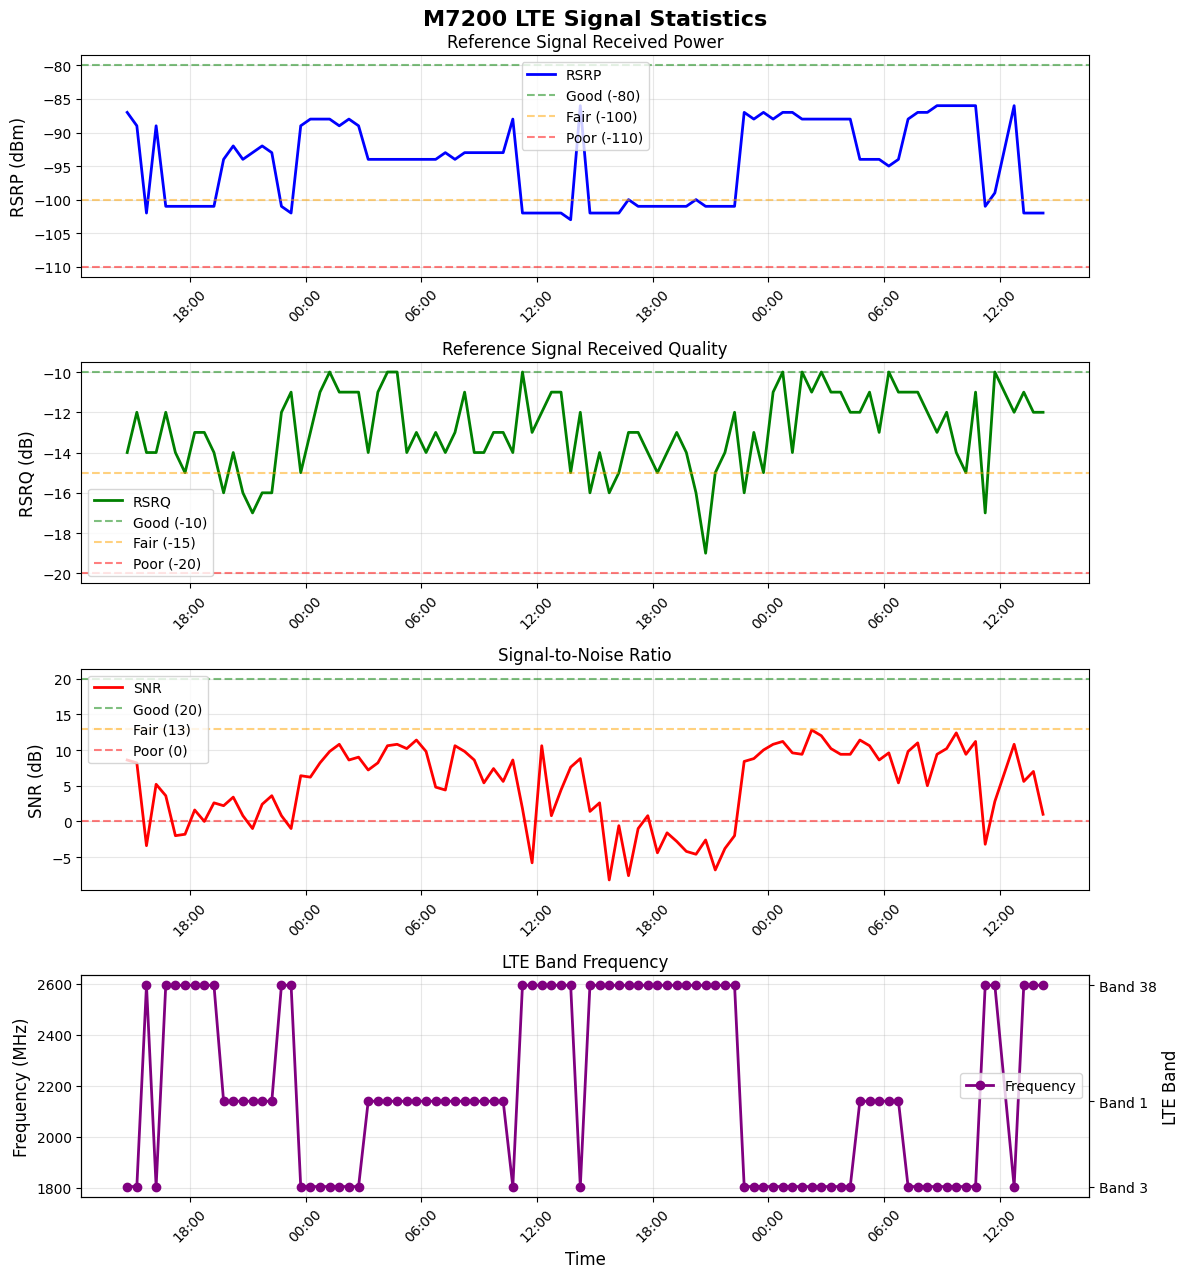 code to gather data from M7200
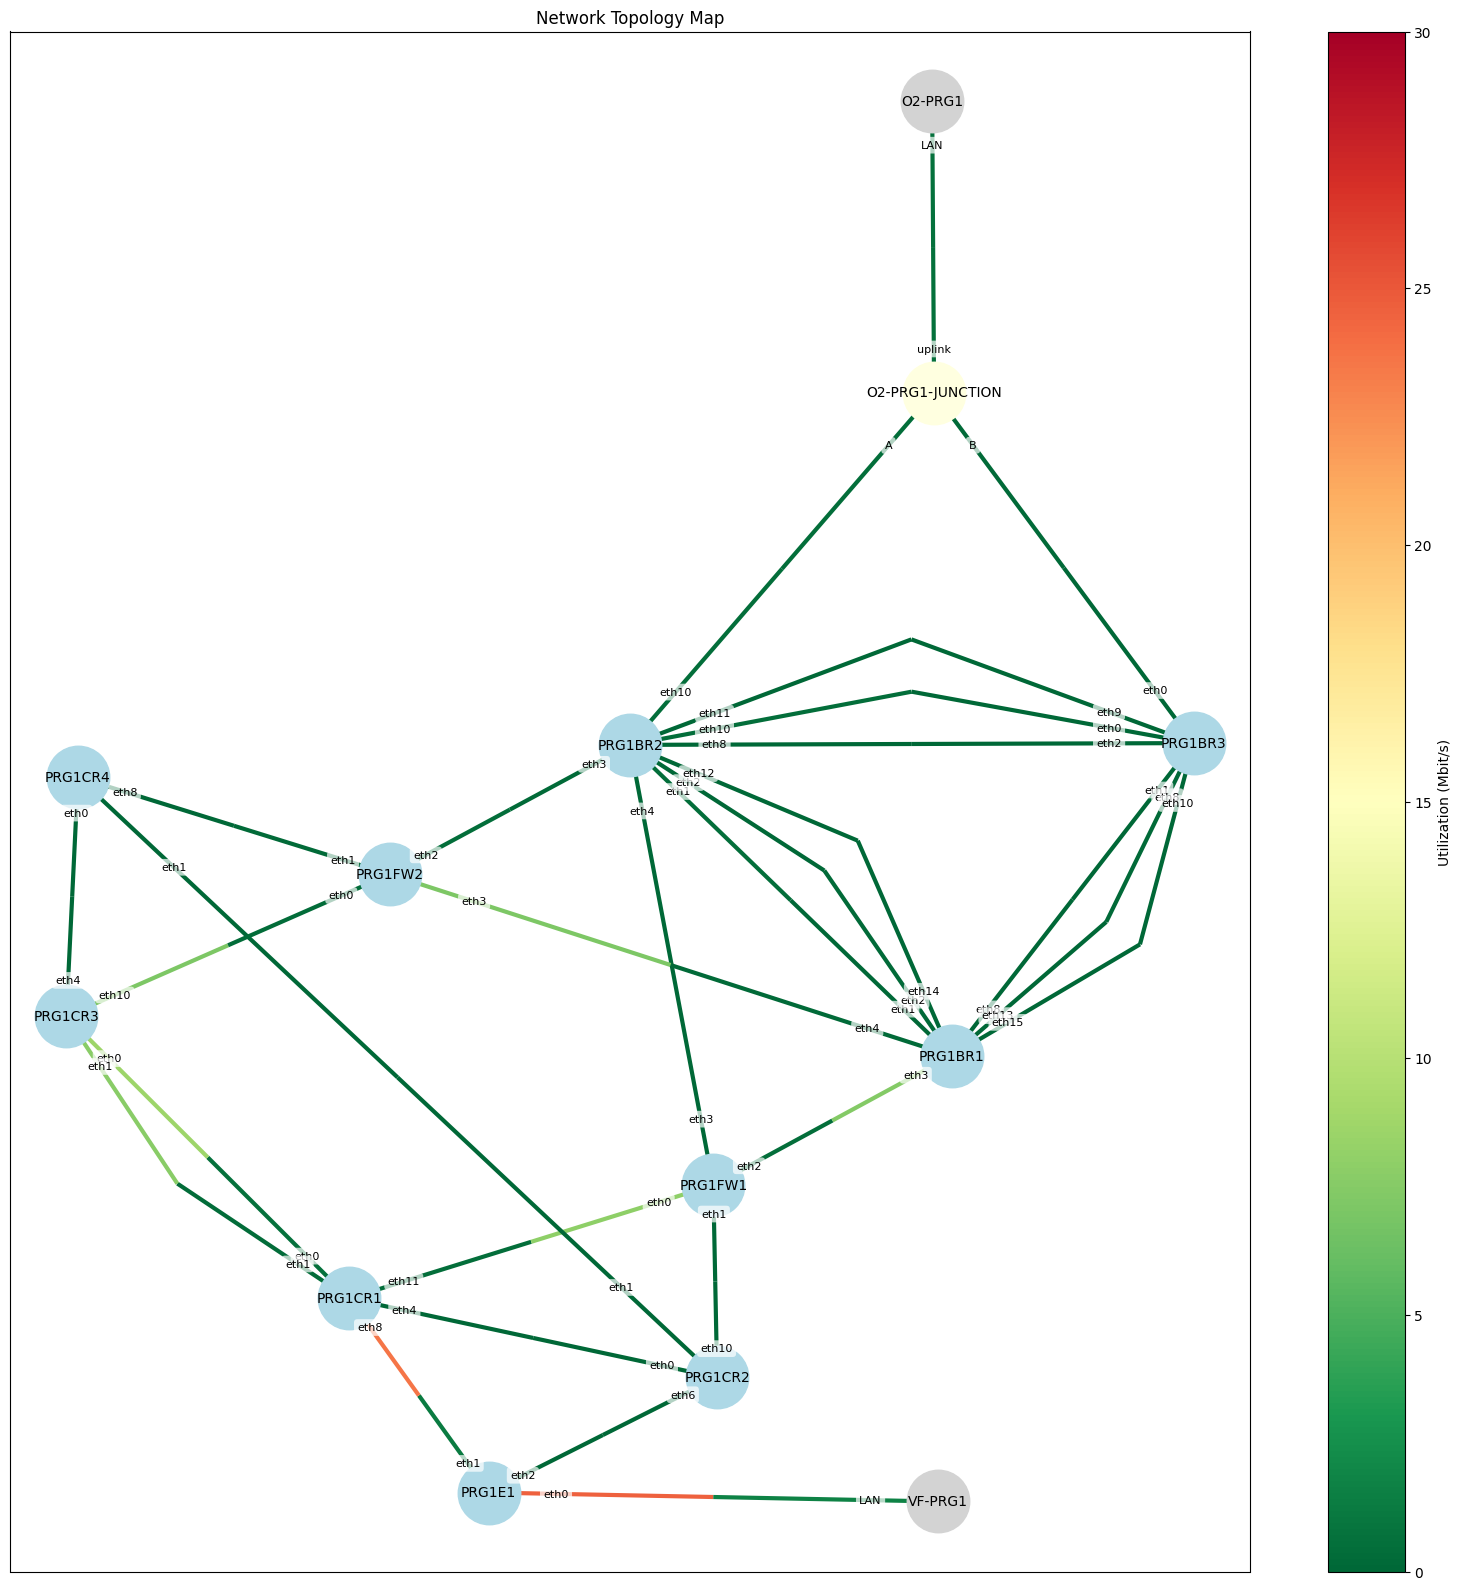
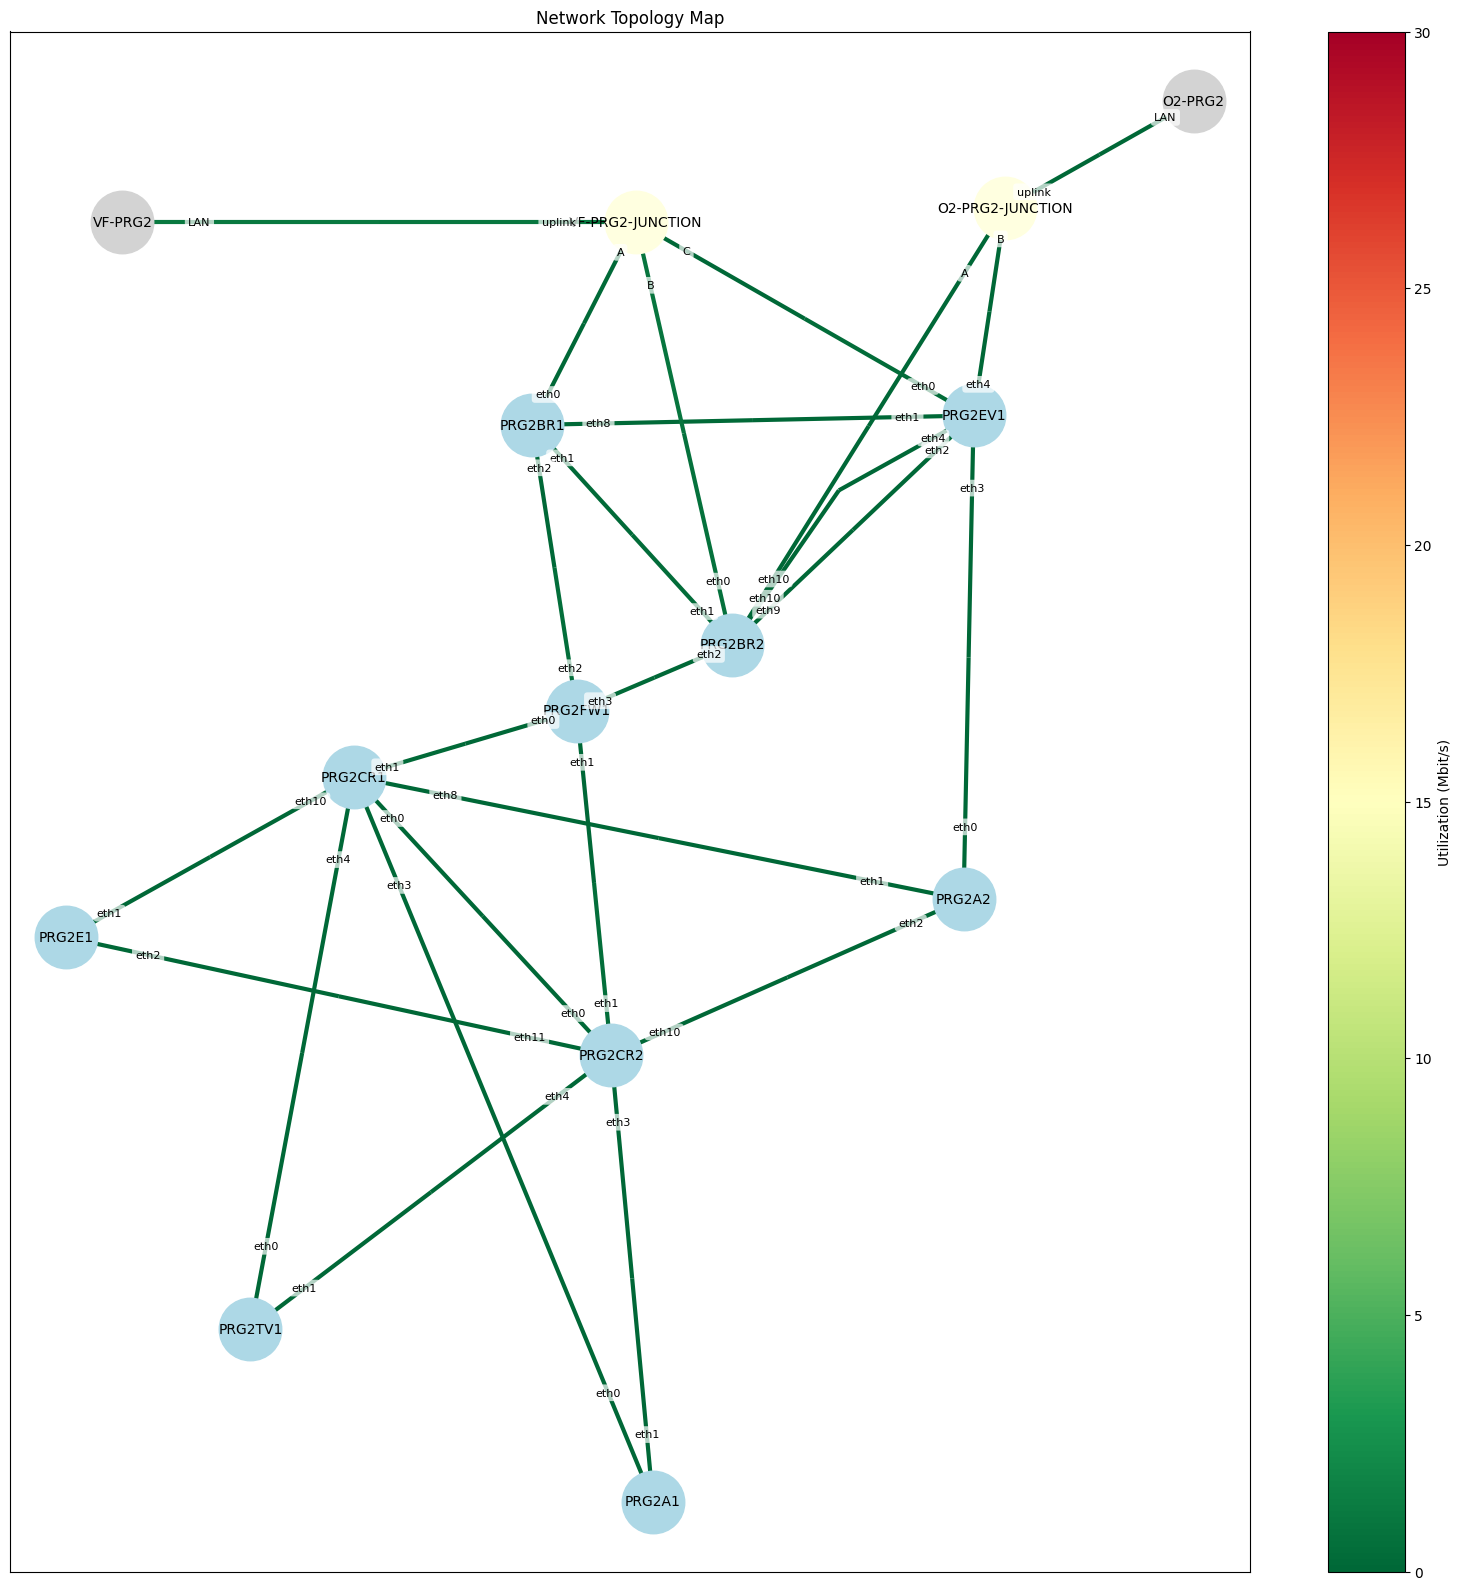
Weathermaps
PRG1 Core
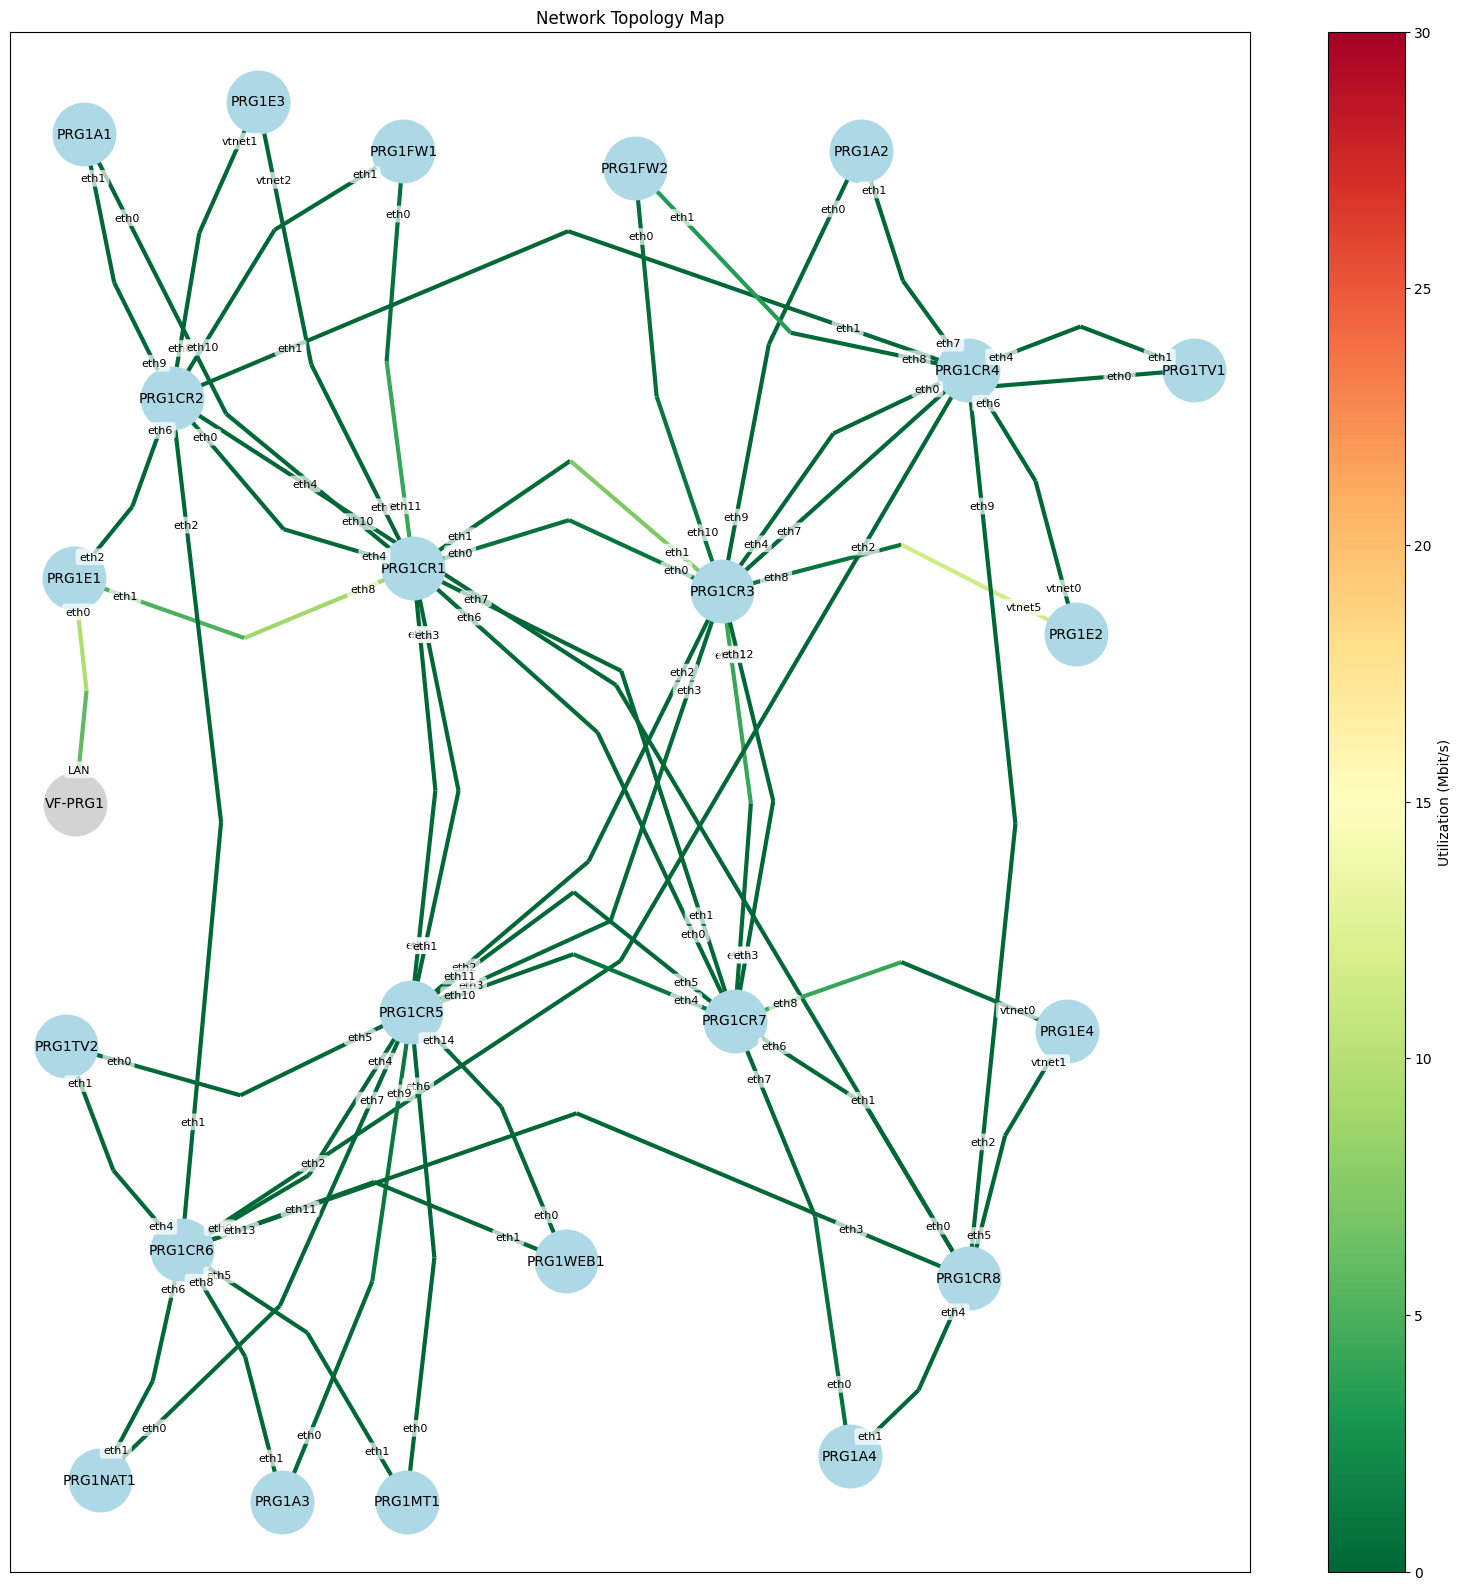 code to generate it from LibreNMS data
PRG1 WAN + Part of core
PRG2 WAN+core
Transit Utilization - AS203528
 Dusseldorf - Servperso Transit AS34872
 New York City - Frantech Transit AS53667
 Luxembourg - Frantech Transit AS53667
 Zurich-to-Ostrava1 GRE Openfactory Transit AS41051
IXP and virtual IXP utilization - AS203528
 LocIX Dusseldorf
 LocIX Frankfurt
 4IXP via Tunnel
Latency - AS203528
 OSR1CR5 to AMS1BR1
 OSR1CR5 to NYC1BR1
 OSR1CR5 to LUX1BR1
 OSR1CR5 to OSR2BR1
 OSR1CR5 to FFT2EV1
 OSR1CR5 to FFT2EV2
Latency - Linodes
 OSR1CR5 to NYC2EV1
 OSR1CR5 to FFT1EV1
Port utilization inside OSR1 over 2.5GbE switch.
 SRV20 2.5GbE Port 1
 SRV20 2.5GbE Port 2
 SRV30 2.5GbE Port 1
 SRV30 2.5GbE Port 2
 SRV40 2.5GbE Port 1
 SRV40 2.5GbE Port 2
 SRV60 2.5GbE Port 1
 SRV60 2.5GbE Port 2
Port utilization inside OSR1 over 1GbE switch.
 SRV20 1GbE Port 1
 SRV30 1GbE Port 1
 SRV40 1GbE Port 1
 SRV60 1GbE Port 1